From NY State Office of Parks, Recreation & Historic Preservation (Sept. 2010)
Surveys were undertaken on eight shared-use trails to see who uses these trails, how far they travel to a trail, and what they spend and on what items.

For many trails throughout the United States surveys have been conducted and results have been published regarding the economic benefits of those trails. These economic benefits tend to be in a few distinct categories. It has been reported that trails may increase property values for those residential dwellings that are proximate to the trail. It has also been reported that these amenities are highly sought out by new home buyers. Although not quantified, it has also been deduced that trails produce general economic benefits to a community through increased physical activity and a corresponding improvement in public health.
However, both the public and community leaders tend to focus on the direct economic impact of trails relating to the spending patterns of trail users. These impacts are broken into two groups: spending related to a specific visit to a trail and spending on equipment and clothing to support the recreational activities associated with trail use. These types of spending are referred to as soft expenditures and hard expenditures respectively in prior studies. Various studies have estimated the per visit expenditure by trail patrons. These estimates have varied widely from a few dollars per trip to well over $30 per visit.
An often-quoted 1992 National Park Service study (Moore, 1992) of three rail-trails— the Heritage Trail in rural Iowa, the St. Marks Trail located outside Tallahassee, and the Lafayette / Moraga Trail in the developed suburbs of San Francisco— found that trail use generated from $1.2 to $1.9 million annually in economic activity and pumped from $294,000 to $630,000 into the economies of trail communities. Per user direct expenditures ranged from a low of $3.97 to $11.02 for consumable items and $130 to $250 for durable goods associated with trail use in the prior year. Consumable items included food, lodging, transportation and any visits to local attractions while durable goods were primarily recreation specific clothing accessories and equipment (e.g. bicycles).
More recently the 2007 User Survey and Economic Impact Analysis on the York County Heritage Rail Trail (Knoch 2007) reported an average per trip soft good (consumable) expenditures of $12.86. Soft good expenditures were reported by 72% of respondents. Hard good expenditures were reported by 85% of the respondents and averaged $367. The 2007 Survey also compared results of three prior surveys that had been undertaken on the same trail beginning in 1999 when the trail opened. Hard good expenditures, mostly bicycles and bicycle related expenses have remained relatively stable, $337 to $367, while soft good expenditures have nearly doubled $6.47 to $12.86. It is suggested that the increase is attributable to a much longer and developed trail system.
A 2006 study of the Pine Creek Rail Trail in Pennsylvania, suggested that each trail visitor spent $30 per trip. A 1994 study of the Maryland Central Rail Trail placed trail spending at $8.33 cents per trip. A 2004 study undertaken on behalf of the Virginia Department of Conservation of the Virginia Creeper Trail concluded that every trail visitor generated a net economic value of between $23 and $38 per person visit and supported 30 jobs in the area. The study determined that visitors had contributed $1.2 million directly to the local economy.
Unfortunately within New York, there is little reported information in this area. A 2003 Economic Impact Study as reported in a publication on the Future of the NYS Canal stated that there was $384 million in economic benefits generated by the Canal. A 2002 “Conversion Study” of those who made phone or web based inquiries to visit the canal spent $625 on their vacation. Fifty five percent of those who visited spent between 1 and 3 days on the canal and reported that hiking and biking along the canal were their most favorite activity. Unfortunately neither study attempted to segregate trail use related expenditure by visitors. A 1998 survey and report prepared for the Mohawk Hudson Bike Hike Trail by the Schenectady County Department of Planning estimated per trail visit spending at $1.16 per visit. This estimate used “zero” spending for 65% of the trail visitors.
Utilizing the methods that had been developed within these other studies, surveys were undertaken on eight shared-use trails during the summer of 2008. The surveys were undertaken in partnership with the trail stewards who care for these various trails. The survey data leads to conclusions about who uses these trails, where trail patrons come from, how far they travel to a trail, how far they travel on a trail, what they spend and on what items. With this information in hand, combined with estimates of overall trail use, some estimates of overall trail economic impacts to communities and the state can be made.
Work such as this has not been preformed in New York in the past. This study was coordinated with others such as the Capital District Transportation Committee and the New York Canal Corporation, who have performed prior studies on estimating trail use.
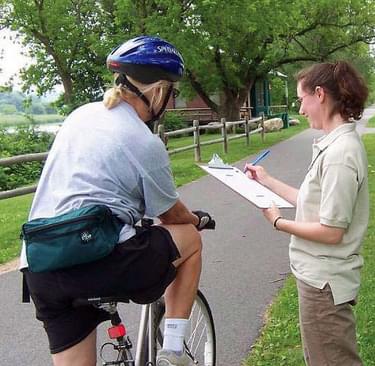
As part of the survey, trail users were asked questions regarding their spending. This included how much they spent on various trail-related equipment during the past 12 months and how much they spent during their most recent trip to the trail on food, accommodations and non-automobile transportation (e.g. train fare, airline tickets). Automobile expenses were estimated based on the distance of the trail-user’s home zip code to the trail entrance nearest the survey distribution box. This distance was multiplied first by 1.1 to account for road vs. straight-line differences and then multiplied again by $0.19. This dollar/mile figure was selected because during 2008 this amount was the allowed deduction for medical travel by automobile. The other two figures used by the I.R.S. were $0.55 for business travel and $0.14 for charitable work. The $0.55 figure includes fixed costs of owning an automobile (depreciation, insurance, etc.). This would be inappropriate for this type of analysis because business might be the primary reason for owning a car but owning a car for the primary purpose of visiting a trail is not likely. The $0.14 charitable figure is fixed by legislation and is probably not accurate for 2008. The $0.19 figure is a reasonably accurate estimate of the additional per mile cost of operating an automobile which is the decision that most car-owning trail visitors would make.
The total cost of visiting the trail was calculated by adding the food, lodging and auto/non-auto transportation costs. Trail users also spend money on equipment for recreational use. The survey asked trail users “Has your use of this trail influenced your purchase of: (check all that apply)” followed by the six items listed below, "Nothing" and "Other":
The median amount spent by the trail users on equipment is $200.00.
A trail can have an economic impact on the community in several ways. Indirect impacts such as increased property values for residences and businesses located near the trail, as well as health benefits to users of the trail. However, the economic value is determined to a large extent on the number of trail users, how many of these come from outside the immediate vicinity of the trail, how much they spend on their visits to the trail, etc. This is why the extent of traffic on the trail over the course of a year is so important to determine. The methodology developed by Dr. Lindsey is very useful because it is a simple, inexpensive way to develop this information.
Once there exists a reasonably reliable estimate of annual trail usage, the 2 next important pieces of data are information on trail use expenditures and the number of trail visitors who are not from the nearby community. Local spending is not included in economic impact estimates because these expenditures are assumed to have occurred anyway.One of the most important ways many recreational facilities can affect the community in which it is located is by attracting visitors from outside the area who then spend money while visiting the area. However, this survey showed that most use of trails is local. The median distance travelled to get to the trail for all 8 trails was 4.8 miles, ranging from a low of 3.6 miles for the Lehigh and Auburn Trail to a high of 11.2 miles for the Chautauqua Rails to Trail. It would seem that this measure, indicating a high proportion of local users, shows that trails have a limited economic impact on their communities. Other benefits to the local community are still important, especially health benefits (getting youths outdoors, fighting obesity, etc.).
A more thorough analysis to determine this economic impact was done with the responses collected at the D&H/O&W trail. The D&H/O&W trail was selected because they had done more trail counts than other trails and this would result in a more reliable estimate of annual usage of the trail. The methodology for estimating yearly use of a trail from a trail count was developed by Dr. Greg Lindsey of Indiana University. Using the methodology developed by Dr. Lindsey, estimates of annual usage were calculated that ranged from roughly 35,000 visits to 65,000 visits. The average of the 7 annual estimates was 48,000 and this is the figure that was used in subsequent calculations of economic impact.
Reviewing the survey data collected on the Town of Hurley Rail Trail, it was found that about 10.5% of the trail users were non-local. Non-local users were found to spend more money in connection with their visits to the trail than local users. They averaged $202.35/trail visit versus an expenditure of only $5.19/trail visit for local users.
Assuming a multiplier effect of 2.0, (typical for this type of spending in an area similar to where this trail is located, the economic impact would be about $2 million which would support about 40 jobs within the community. Additional economic impact exists because of increased tax revenues to the local community. Currently, Ulster County has a sales tax rate of 8% of which 4% leaves the local area and goes to New York State.
The above is just the affect of one trail on its community. The results for other trails in the 2008 Trail User/Economic Survey will also be studied. However, because the total number of trails within New York State is not known and trail usage data is not available for many, if not most of the trails in New York State, it is not possible to make a statewide estimate of the economic impact of all of the trails and trail activities in New York State. It would be expected that the 700+ trails currently inventoried may have a significant economic impact.
Statewide, the average group size of people using the trail was 2.74, ranging from a low of 1.95 for the North & South County Trails in Westchester County to 3.63 for the Lehigh and Auburn Trail.
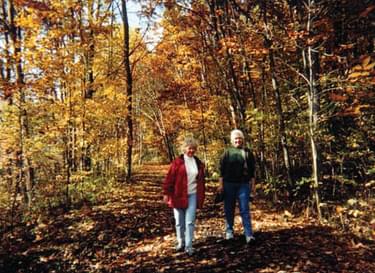
For these 8 trails, walking/hiking and biking were the two main activities which trail visitors had participated in during the previous 12 months (68% for each). The next most popular activity was jogging at 22.1%. This was a summer survey so people who use these trails exclusively in the winter would not have completed survey forms. For this and other reasons, cross-country skiing (10.2%) and snowmobiling (0.8%) percentages may be lower than the actual usage.
“Health & Exercise” surpassed “Recreation” as the reason for using the trail by 51.1% to 22.5%. The remaining 26.4% was divided among many differing responses.
The average age of the trail user completing the survey was 52 with little variation among the trails. Statewide employment status was 52% employed full-time; 25 retired and the rest in the remaining categories. Sixty percent of those completing the survey were male. Average household income for the survey is $94,113.
Attached document published September 2010
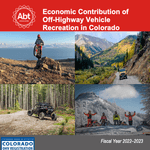
2023 Economic Contribution of Off-Highway Vehicle Recreation in Colorado
posted Apr 24, 2024
Colorado offers unique opportunities for motorized recreation throughout much of the state. As such, the sport and industry of motorized recreation has increased in popularity in Colorado, both for residents and non-residents. Abt Global, LLC (Abt) evaluated the economic contribution of motorized recreation throughout Colorado for the 2022–2023 season (July 1, 2022 through June 30, 2023). This study is an update based on a previously conducted study, completed in December 2016, that estimated the economic contribution for the 2014–2015 season, referred to as the “2016 study” in this report.
Wisconsin ATV - UTV 2023 Economic Impact Report
posted Apr 24, 2024
In 2023, ATV/UTV riders in Wisconsin were responsible for generating an estimated $4.2 billion in direct economic activity, supporting the creation of 25,845 jobs. This spending was distributed across a wide range of industries including motor vehicle dealers, lodging facilities, restaurants, gas stations, and retail stores. The study provides detailed insights into the scope and size of Wisconsin’s ATV/UTV industry, demonstrating its significant economic footprint.
Bridging the Urban-Rural Economic Divide
posted Oct 26, 2023
It’s time for the narrative to shift from urban vs. rural to a shared economic future. Bridging the economic divide between urban and rural areas will require states, regions and localities to understand and bolster the relationship between urban and rural areas in economically meaningful and strategic ways.
Great Allegheny Passage Economic Impact Report
posted Oct 19, 2023
This report was developed by Fourth Economy in partnership with the Great Allegheny Passage Conservancy (formerly the Allegheny Trail Alliance). Research was conducted between the fall of 2020 and the spring of 2021.
1,086 views • posted 03/05/2018