A Data Driven Approach
As the summer unfolds, park and trail managers across North America are preparing for yet another recording breaking season. While it is too early to make definitive calls about the state of pandemic trail boom and future volumes on trails and in parks, early analyses suggest the boom is alive and well. During this unprecedented time, automated count data serves as a crucial tool to track changes, understand use, and make the work of trail managers just a little bit easier.
by Matt Ainsley, Market Strategist, Eco-Counter, Inc.

For park managers and everyday users, the 2020 boom in trail use is well known. With pandemic restrictions in place, the outdoors became ‘essential spaces’ for people to safely recreate, gather and escape during an incredibly difficult time. Across the country, trail use skyrocketed during the pandemic, up 79% between March and July 2020 according to data from Rails to Trails Conservancy. From local forest paths to national parks and large outdoor recreational destinations, trails volumes reached new heights in 2020. Consumers felt the pressure too, with outdoor recreation goods near-impossible to find. Bike shops, for example, saw unprecedented demand in 2020 and the industry is still reeling from supply shortages and long waits.
But what does the ‘trail boom’ actually look like out on your local trails? How have hourly, weekly and monthly trends changed since the pandemic?
Automated counters (also known as trail counters or people counters) provide trail managers an objective basis for understanding how and when trails are used. Trail counters, such as our ever-popular PYRO-Box, count the numbers of people passing a location on a trail each day. These data are essential to justify trails, inform maintenance schedules, support grant funding and much more.
So, with that said, let’s take a whirlwind tour around the country to dig into some trail count data to better understand how the pandemic has actually impacted trail use… First, let’s go to the west coast.
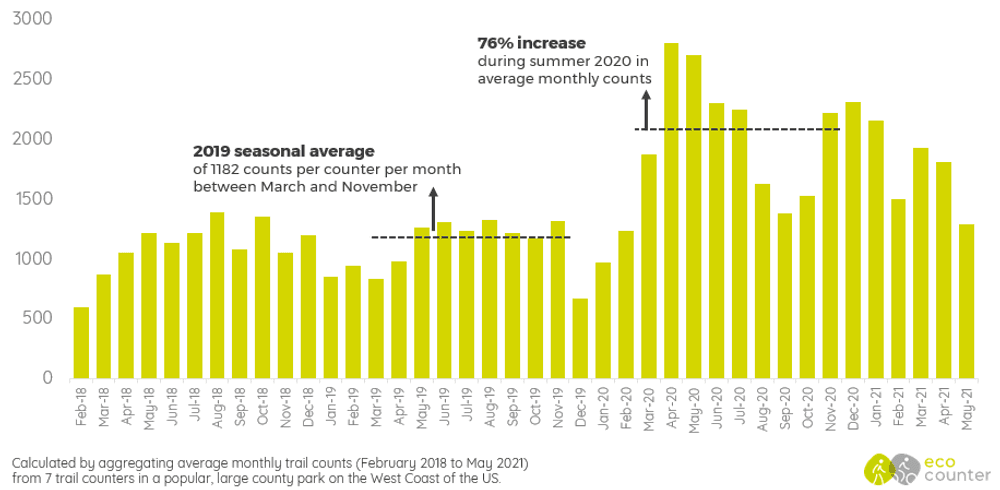
Analyzing monthly trail count data from a large regional park on the West Coast, we can quickly visualize the impact of the pandemic on trail volumes. This particular park has seven trail counters – a mix of bike, pedestrian and MULTI counters – and is close to a large city that implemented early pandemic restrictions. The chart below plots average monthly trail counts, by counter, between February 2018 and May 2021.
Note: throughout this article we are not naming or locating the trail networks in order to respect the privacy of our clients and partner organizations.
At this level, the impact of the pandemic becomes clear. During the 2019 peak season – defined here as March to November – average monthly counts, per counter, were 1182. During the pandemic summer of 2020, that monthly average jumped to 2075, a 76% increase. In the months of April and May, the height of the pandemic, counts were particularly elevated at over 2,700 per month.
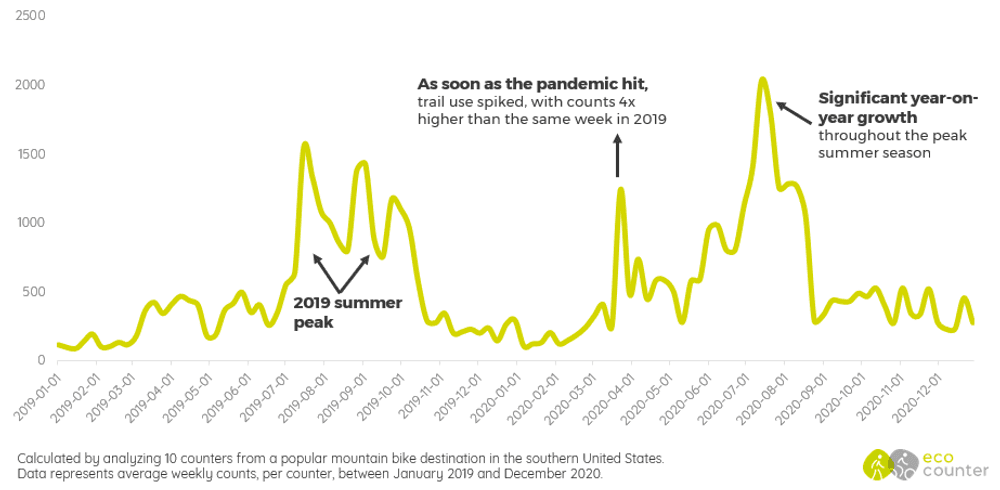
If we head a bit southeast, to a famous mountain bike destination in the south, similar trends can be seen. Here, trail count data from 10 counters around the mountain bike network are aggregated, and the graph below plots average weekly counts, per counter, from the start of 2019 to the end of 2020.
Just like on the west coast, here we see a significant spike in trail use as soon as the pandemic hits – with counts four times higher than the same weeks in 2019 – followed by strong year-on-over growth throughout the summer months.
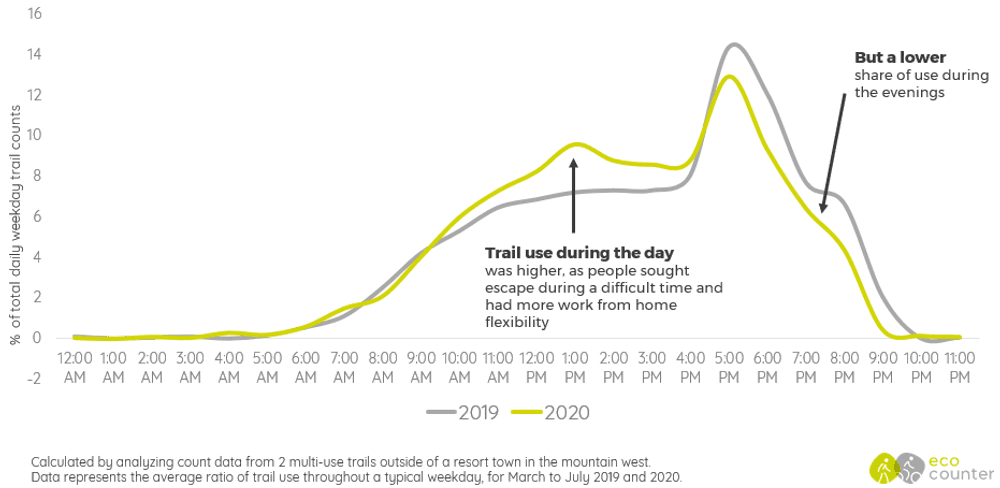
Let’s now go beyond looking at weekly or monthly volumes. If we zoom in on how trail use shifted during the pandemic, some more subtle, less well-known trends emerge. Let’s take the example of multi-use trails outside of a popular resort town in the US mountain west. If compare how the trails were used during weekdays by hour in 2019, compared to 2020, we see a small shift in use patterns. Note: the chart below does not plot total trail volumes on the Y-axis, but illustrates the share of total counts throughout the day.
This shift in trail use tells an interesting story. During the pandemic, relative use was higher during the day, and lower in the evening – perhaps because people had more work flexibility, or needed an escape during the day. Although a small shift in use, these data are essential for trail managers to inform maintenance schedules and security.
Further to the north, in Winnipeg Canada, a more dramatic version of this shift unfolded on an urban multi-use greenway trail. To show this, we once again plot the share of total weekday daily counts by hour, but this time we compare January and February 2020 (before the pandemic) to March and April 2020, the height of lockdown.
The shift here is dramatic. Whereas before, the trail was clearly used by commuters, as a spike in usage occurred at 8/9AM and once again at 5/6PM. The pandemic almost completely eliminated those rush hour peaks and the trail was instead used mostly throughout the afternoon and evening – once again, a place of safe refuge and escape during a difficult time. When we dug further into the data for this same trail, our analysis showed that trail use shifted towards the weekend, once again reflecting a step away from commuting use.
--
Interested in learning more about trail counters, data and a data-driven approach to park and trail planning? Join Eco-Counter, American Trails and a panel of experts for a webinar on November 10th 2021 at 1-2:30PM ET. In the meantime, you can always reach Eco-Counter at [email protected].

Matt Ainsley is the Market Strategist for Eco-Counter in Montreal. Matt’s role in Eco-Counter revolves around ensuring organizations have the best tools necessary to collect and communicate robust, accurate, and powerful bike and pedestrian count data. Outside of work you can usually find Matt mountain biking, ski touring, or hiking in Quebec’s Laurentian mountains.
Contact: [email protected]
posted Apr 17, 2024
This report summarizes guidance and best practices to create safer bicycle facilities and connect them into networks that allow more people to safely bike to more places within and throughout communities.
Setting Speed Limits for Health and Safety
posted Apr 17, 2024
This mini-report on setting speed limits shows the current framework for speed limit policies through a review of state laws that set speed limits.
posted Nov 14, 2023
These case studies reveal a number of lessons learned that will be valuable in future winter travel management planning efforts.
TRAILS SAFE PASSING PLAN: STOP, SPEAK, and STAND BACK
posted Feb 14, 2023
Horses are prey animals and naturally can be afraid of unfamiliar people and objects. Horses have natural "flight“ survival instincts and prefer to move their feet towards an exit route. Therefore, people with horses should pass at a walk while other trail users remain STOPPED until passed.
7,334 views • posted 08/10/2021